Code
Interactive & choropleth mapping
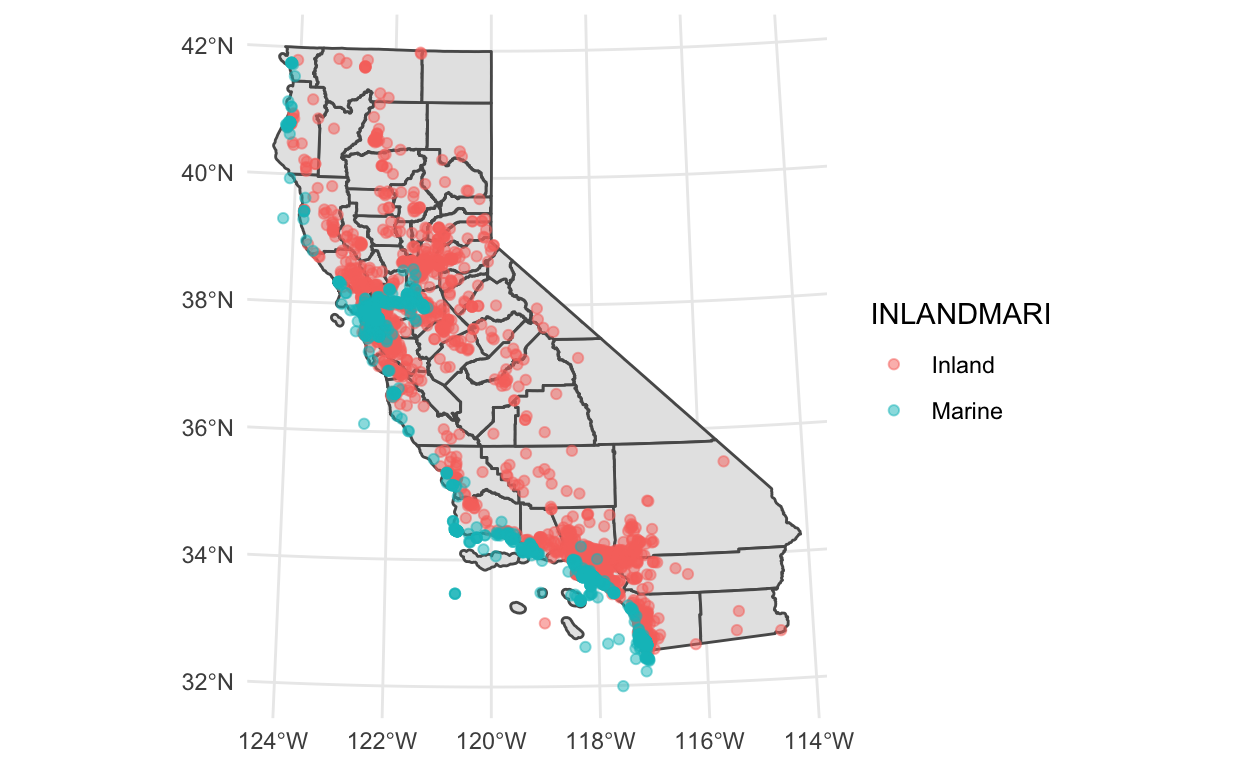
In this post I use publically-available data on California Oil Spills to show how to quickly and easily create an interactive map using tmap. I also use these data to create a choropleth map showing the number of inland oil spills per county.
Text analysis
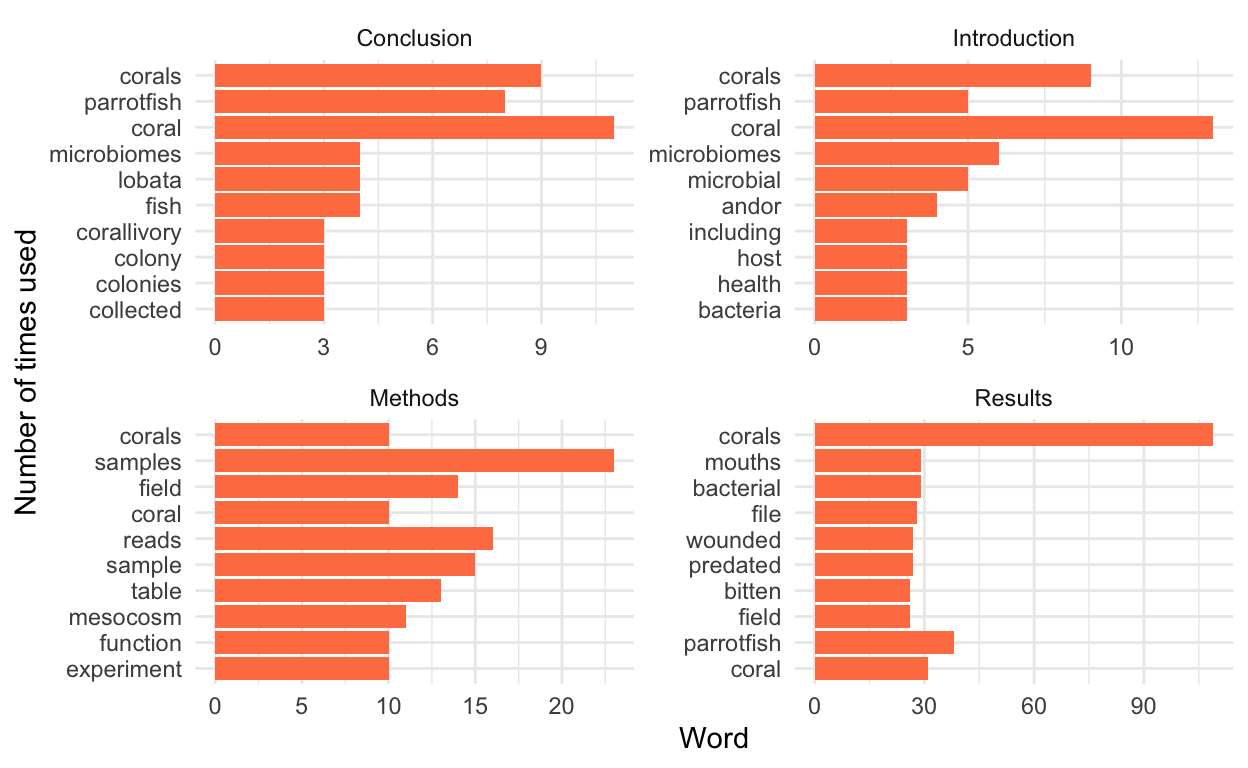
A brief example demonstrating how to conduct text analysis in R using tidytext--for fun I compare the most recent manuscripts from my M.S. and PhD advisers' labs.
Working with rasters
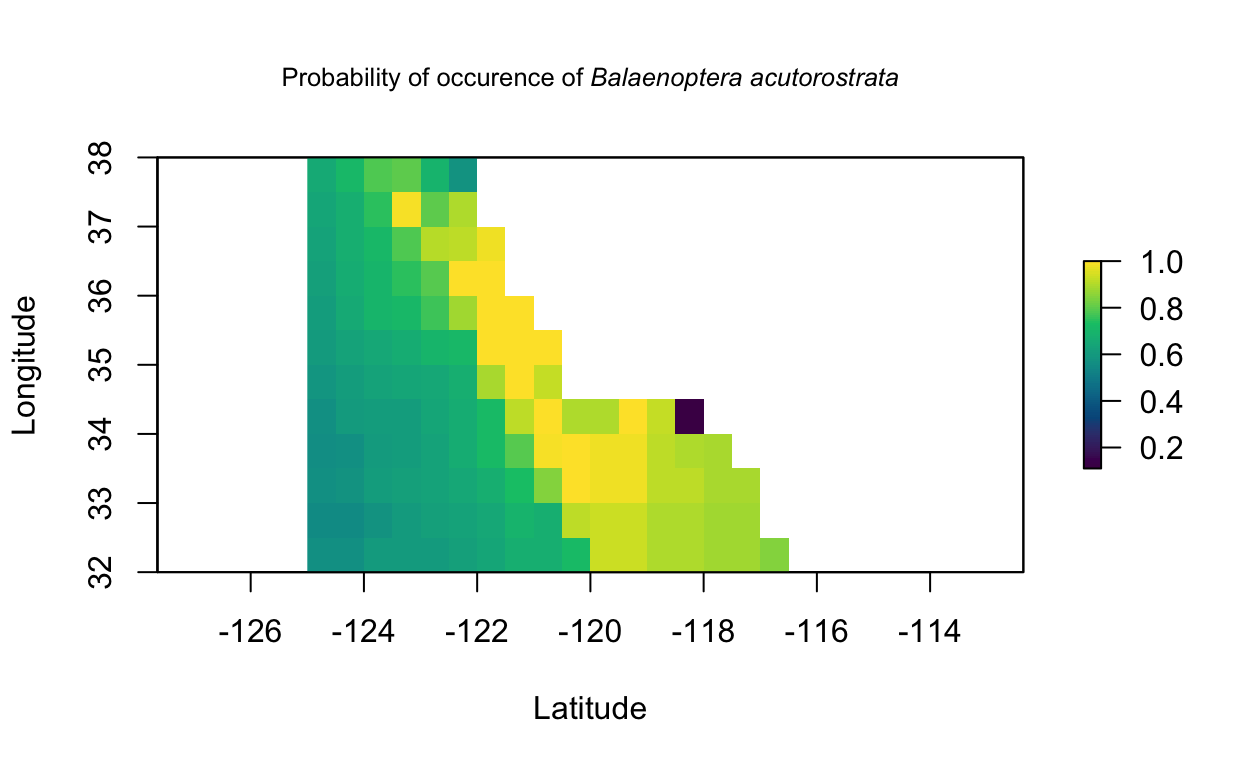
In this post I use the output of a model describing the likelihood of Californian cetacean presence to create a raster of predicted species diversity off the coast of southern California.
Principal Components Analysis
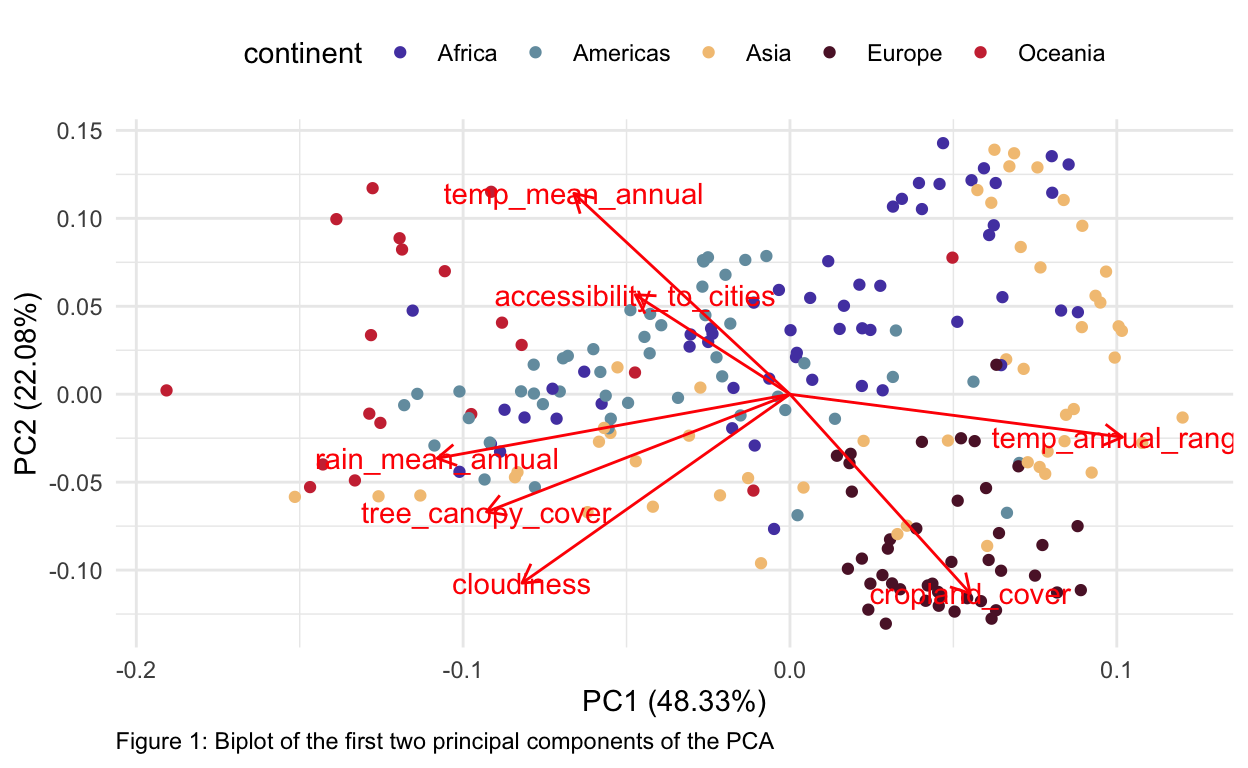
Example of how to create a quick biplot using global environmental variables.